Guides
A guide to building a U.S. solar service-area map around utility territories
Draw a solar service-area map on utility territory lines, not ZIP codes, so crews, filings and marketing follow the grid your jobs depend on.
What to take away
- Territory lines decide which interconnection office reviews your filing, so a ZIP-based map hides the split that causes rework.
- PG&E, SCE, Duke Energy and ConEd each run their own queue, paperwork path and inspection pace.
- Cluster jobs by interconnection office first, drive time second, inspection window third. Never by ZIP.
- Score each territory on addressable homes, queue time, close rate and cost per lead, then cap the spend.
- Review the map quarterly. Utilities redraw service areas and queues move faster than an annual look.
Why utility territory boundaries beat ZIP codes
A ZIP code was drawn for mail. It can straddle two utilities, two inspection regimes and two net metering tariffs, and nothing on the envelope tells you which one a given roof belongs to.
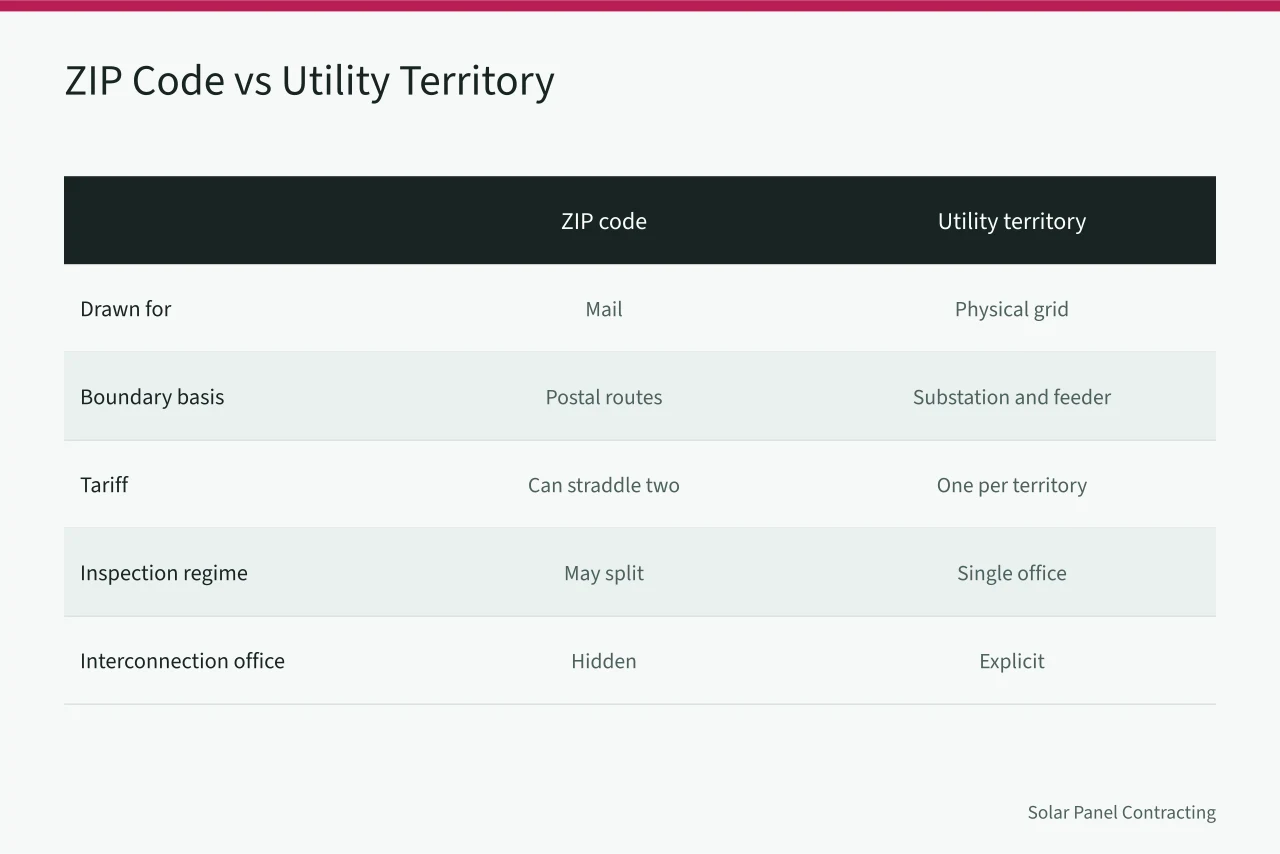
Territory boundaries follow the physical grid. The substation, the feeder and the interconnection office serving a home are the same assets your crew and your paperwork touch. Map on those lines and your service area matches the infrastructure your jobs depend on.
Electricity data from the U.S. Energy Information Administration shows how far retail rates and generation mix diverge by region. Those numbers drive homeowner payback, which drives how hard a territory is to sell in.
Rule changes arrive by territory too. Federal Register environment notices let you catch a change that applies to one utility's queue and not its neighbor's.
The interconnection office is the part a ZIP map hides completely. Two homes five miles apart can report to different offices with different review times, and that gap only shows up once you draw the territory line.
Our service area and utility territory checklist covers the page structure that matches this map.
Reading PG&E, SCE, Duke Energy and ConEd
Start with the four territories most U.S. installers run into, then add your regional utilities around them. Each has its own shape, queue and paperwork culture.
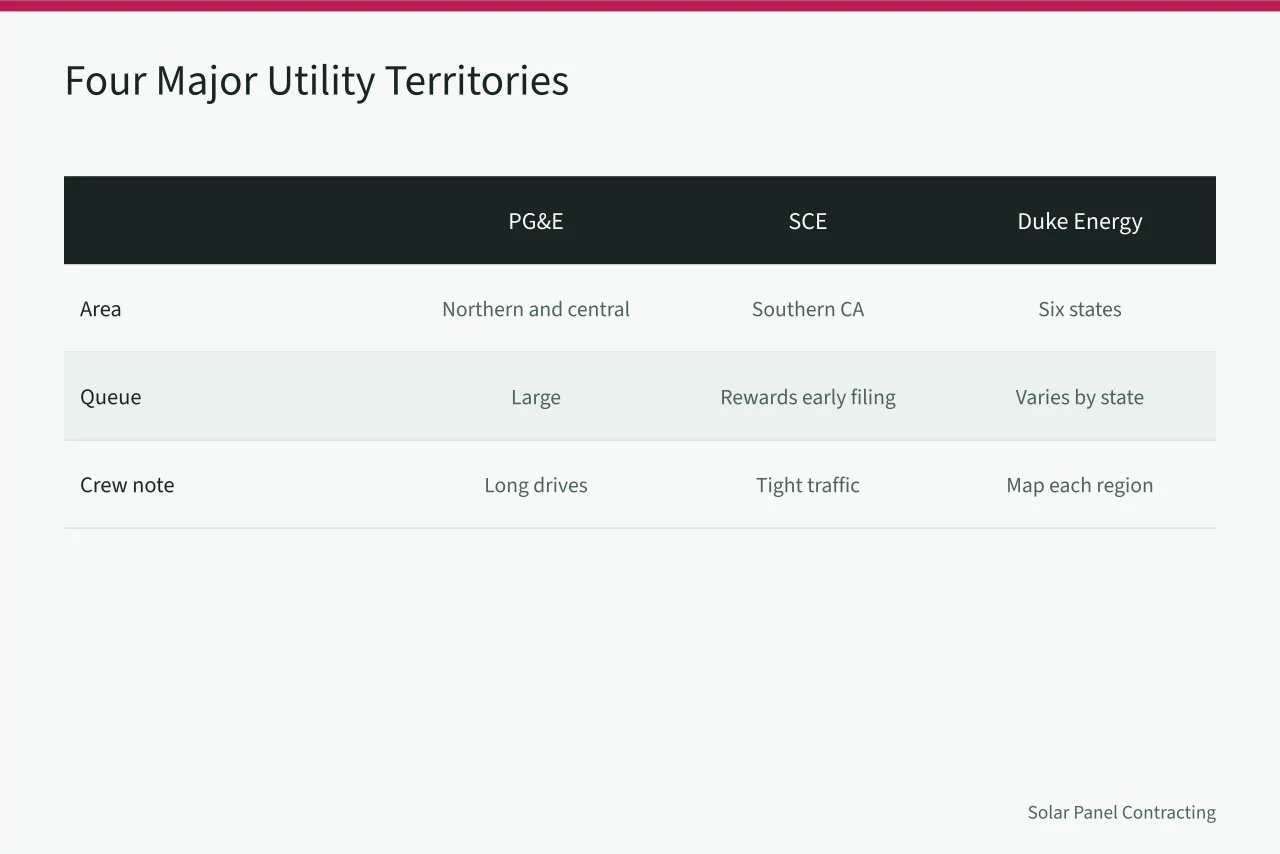
PG&E covers most of northern and central California, including the Bay Area and the Central Valley. It is large, spans coastal fog and inland heat, and runs a long queue in high-demand areas.
SCE covers much of southern California outside San Diego Gas & Electric and the municipal utilities. It is dense, rooftop penetration is high, and the queue rewards early filing. Drives are short, traffic windows are tight.
Duke Energy spans parts of North Carolina, South Carolina, Florida, Indiana, Ohio and Kentucky. That is several grids under one name, and rules differ by state and operating company. Map each Duke region on its own.
ConEd covers New York City and Westchester County. Small in area, heavy in volume, with tight roof access, landmark rules and a queue on its own schedule. Parking and building access matter more here than long-haul routing.
| Territory | Approximate area | Interconnection character | Crew planning note |
|---|---|---|---|
| PG&E | Northern and central California | Large queue, varied climate zones | Long drives, plan fuel and heat breaks |
| SCE | Southern California outside SDG&E and munis | Dense, high penetration, queue rewards early filing | Short drives, tight traffic windows |
| Duke Energy | NC, SC, FL, IN, OH, KY | Multiple operating companies, rules vary by state | Map each state region separately |
| ConEd | NYC and Westchester | Small area, high volume, landmark and access rules | Parking and building access dominate |
A territory map is not a legal boundary. Utilities buy, sell and redraw assets, so check the current map before you commit a crew or a campaign to an edge zone.
State public utility commissions and contractor licensing boards sit above the utility. Confirm with the commission and the board that govern a given territory before quoting a timeline a rep cannot keep.
Routing crews against interconnection office jurisdictions
The interconnection office is where the paperwork lives. A crew that finishes an install and files to the wrong office loses days it cannot bill.
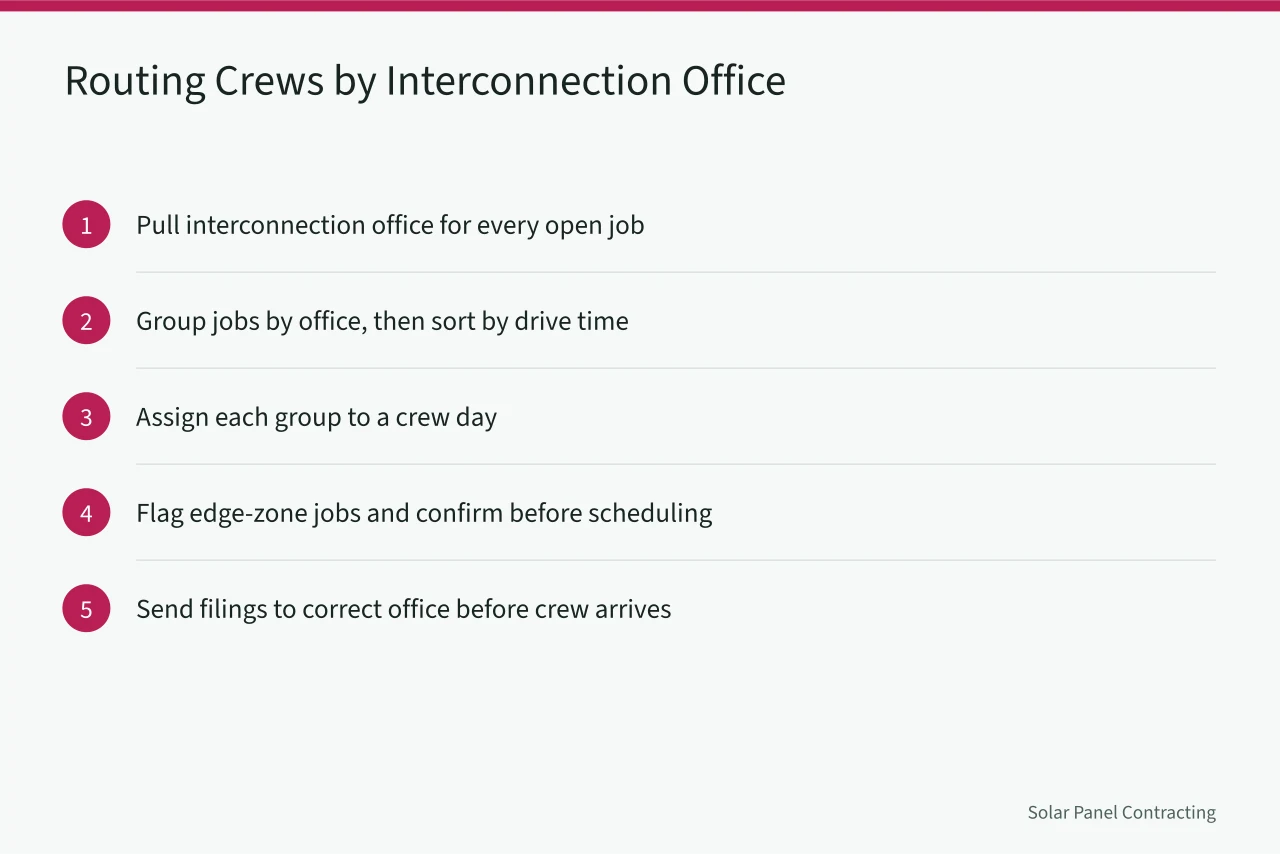
Cluster by office, then by drive time, then by inspection window. A ZIP cluster can split across two offices and force two filing paths into one day.
- Pull the interconnection office for every open job from the utility map or your permit records.
- Group jobs by office, then sort each group by drive time from the yard or the previous stop.
- Assign each group to a crew day so no crew crosses an office boundary mid-day.
- Flag edge-zone jobs where the office is ambiguous and confirm before scheduling.
- Send the day's filings to the correct office before the crew arrives, not after.
Inspection pace varies by office. Some inspect in days, others in weeks. Hold a small backlog of ready-to-inspect jobs in each territory so a slow office does not idle a crew.
OSHA and NEC requirements do not change at the territory line, but local amendments to the NEC can. Note any local amendment on the routing sheet, and confirm scope with a licensed electrician.
For installers weighing a second yard, the business location strategy piece covers how territory shape and queue depth should drive that call.
Allocating marketing spend by territory and queue behavior
Spend should follow the queue, not the square footage. A fast queue with a high close rate earns more budget than a bigger territory that stalls.
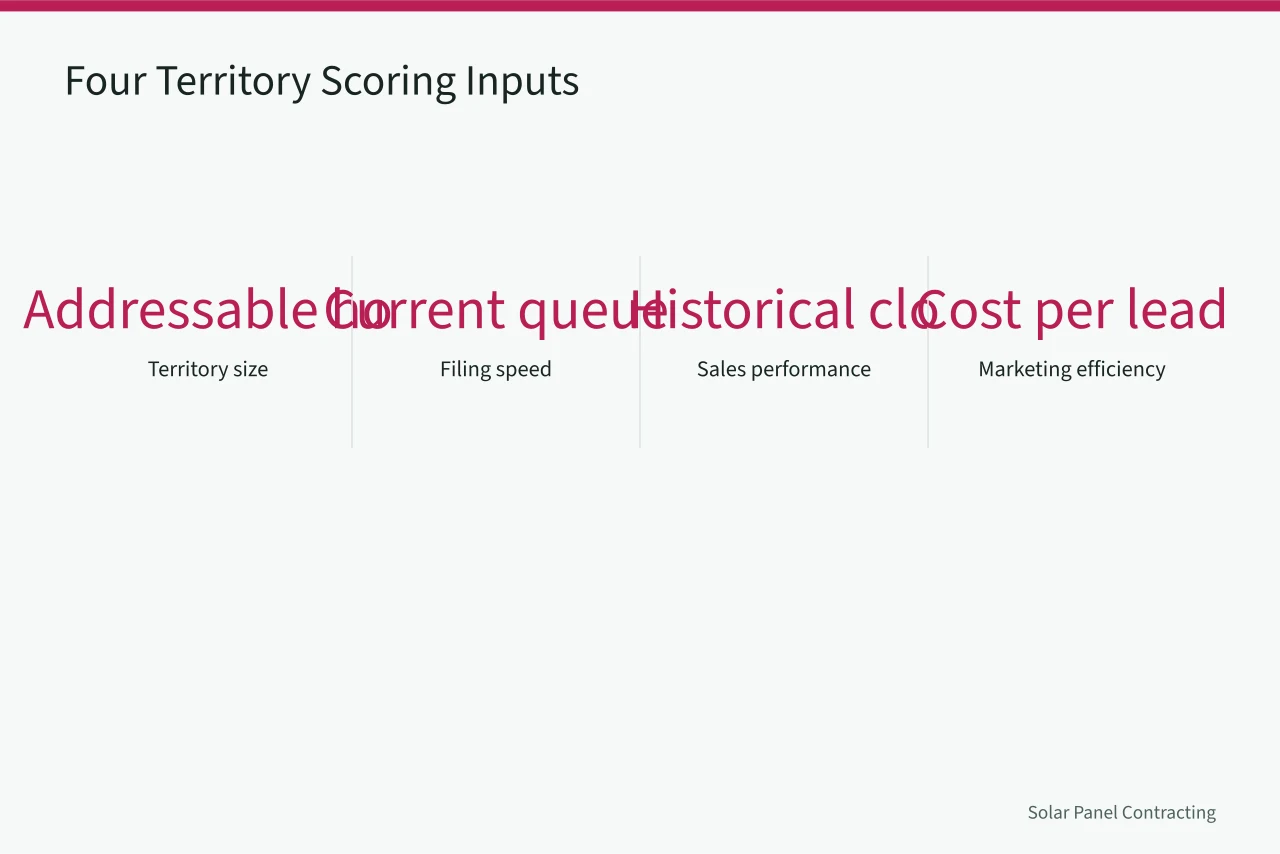
Four inputs set the score: addressable homes, current queue time, historical close rate and cost per lead. Weight them, score each territory, set budget by score, and cap each territory so one hot queue cannot absorb the month.
Queue behavior is the input most installers skip. A long queue is worth buying into when it is predictable and the close rate holds. A short but erratic queue burns budget on jobs that never land.
Messaging differs by territory. The Department of Energy homeowner guide to going solar frames what homeowners actually ask about, from payback to roof condition, and beats one national script.
Claims have to hold. Federal Trade Commission competition and consumer protection guidance sets the standard for describing savings, tax credits and timelines, so a territory-specific claim needs territory-specific evidence.
For the wider picture, see marketing worth your attention.
Building the map, step by step
This method assumes a CRM or spreadsheet holding job addresses and outcomes.
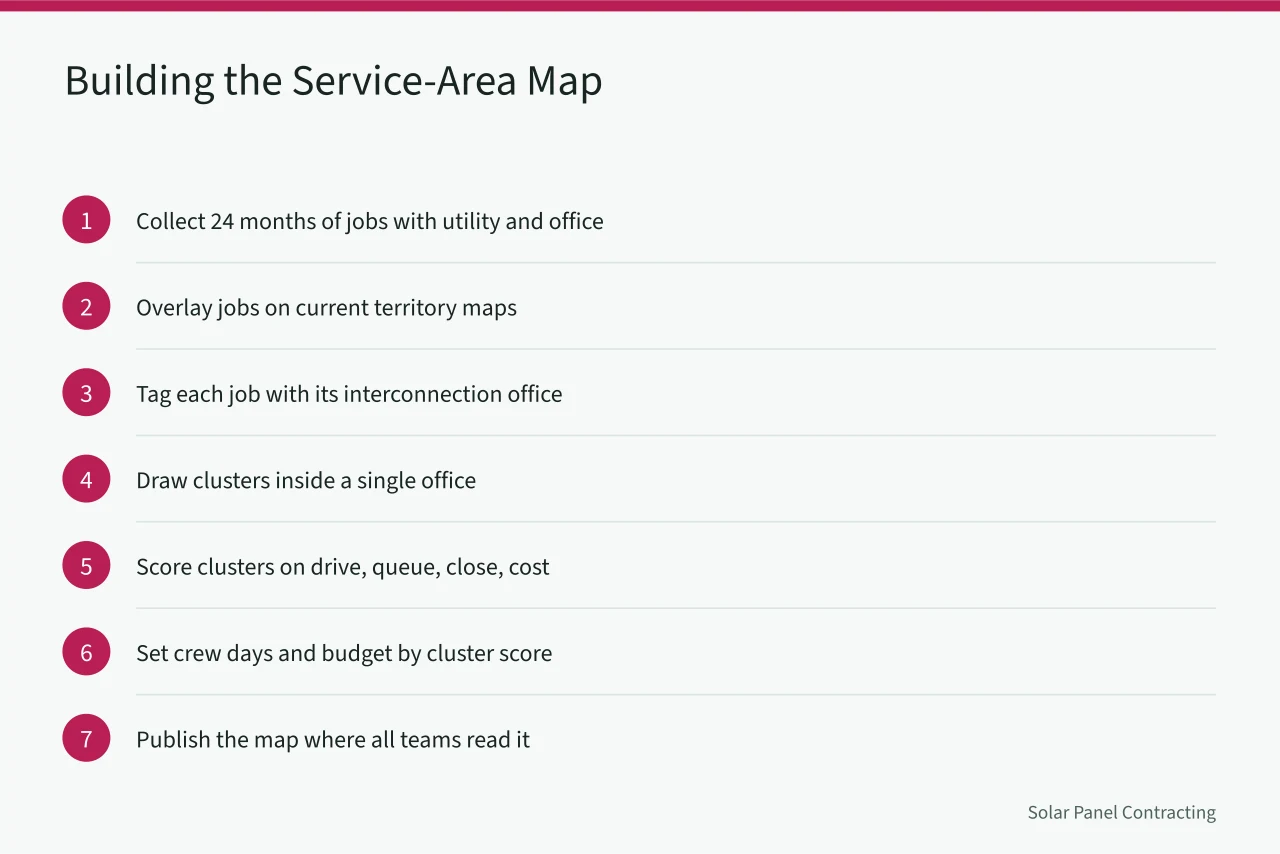
- Collect 24 months of jobs with address, utility, interconnection office, install date, inspection date and close date.
- Overlay those jobs on current territory maps for PG&E, SCE, Duke Energy, ConEd and any regional utility you serve.
- Tag each job with its interconnection office and mark every job that sat in an edge zone.
- Draw clusters that keep each one inside a single interconnection office where possible.
- Score each cluster on drive time, queue time, close rate and cost per lead.
- Set crew days and budget by cluster score, with a cap per cluster.
- Publish the map where sales, scheduling and marketing all read the same version.
A worked example: two crews, one yard. Cluster A sits inside ConEd, small and dense with short drives and a fast queue. Cluster B sits inside PG&E, large and thin with long drives and a slower queue.
Give one crew to Cluster A most days. Run the second crew through Cluster B in blocks rather than single jobs. Spend more per address in A, where close rates and queue speed are better, and spend in B only where drive time and queue time both clear your threshold.
Note on the map which state commission and licensing board governs each cluster. That note is what stops a rep from promising a timeline the utility will not support.
For adding territory, the expansion and market guide covers how to test a new area before committing a crew.
Reviewing the map quarterly against KPI data
A territory map goes stale. Utilities redraw service areas, queues move, and close rates shift with rates and incentives. Put the review on the calendar every quarter.
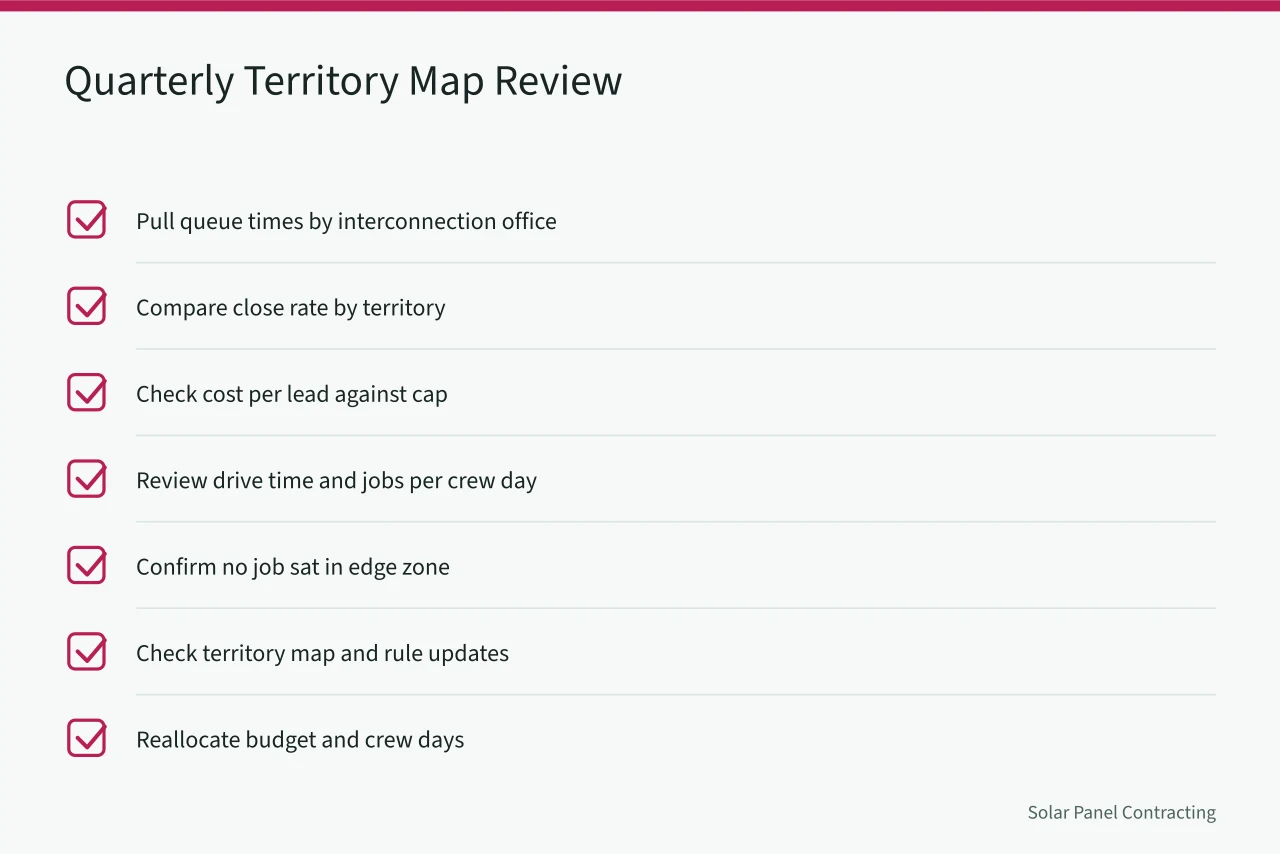
- Pull queue times by interconnection office for the last quarter.
- Compare close rate by territory against the prior quarter.
- Check cost per lead by territory and flag anything above your cap.
- Review drive time and jobs per crew day by cluster.
- Confirm no job sat in an edge zone without a filing path.
- Check for territory map updates or commission rule changes.
- Reallocate budget and crew days by updated cluster score.
The review should take a few hours. If it takes days, you have too many clusters or dirty data.
Set a rule for moving a territory in or out. A territory below your minimum close rate for two straight quarters goes to a watch list rather than the active map.
Tie the map to your monthly KPI routine so territory performance lands in the same review as the rest of the business.
Common questions
Why use utility territory boundaries instead of ZIP codes?
Interconnection offices, queue behavior and inspection rules change at the territory line, not the postal line. A ZIP map hides those splits and the rework shows up later as failed inspections and idle crews.
How do PG&E, SCE, Duke Energy and ConEd differ for crew planning?
PG&E is large with varied climate and long drives. SCE is dense with tight traffic windows. Duke spans several states with different rules per operating company. ConEd is small in area, high in volume, and constrained by parking and building access.
What is the crew routing method in one sentence?
Cluster jobs by interconnection office, then by drive time and inspection window, and keep each crew inside one office jurisdiction per day.
How often should the service-area map be reviewed?
Quarterly, against queue times, close rates, cost per lead and drive time. Utilities redraw territory and commissions change rules, so an annual review is too slow to catch a shift before it costs you a season.